How the pieces of the EU Emissions Trading Scheme actually connect
The European Union does not have a carbon market. It has several, and they overlap. The one most people mean is the EU Emissions Trading System 1 (ETS 1) which since 2005 has put a price on currently roughly 1,170 million tonnes of CO₂ a year from power stations, heavy industry, flights inside Europe and, since 2024, shipping. Operators must surrender one allowance for every tonne they emit, the total number of allowances is capped and falls each year, and the price is whatever the market settles at — about €82 a tonne in August 2026. That much is widely understood.
What is less widely understood is how much else is now bolted onto it. A second trading system, ETS 2, starts in 2028 and will price the fuels burned in buildings and road vehicles — the boiler and the fuel pump — through the companies that supply them. A third instrument, the Effort Sharing Regulation, has covered most of those same emissions since 2013, but as a binding target on national governments rather than a price on suppliers. A border adjustment, CBAM, began charging importers of steel, aluminium, cement and fertiliser in January 2026. Switzerland’s system is legally joined to ETS 1; the United Kingdom’s is not, and is negotiating. Global schemes for aviation and shipping overlap the EU’s scope without sharing its unit. And from 2031 the EU proposes to buy permanent carbon removals, and from 2036 international credits, using money raised by auctioning allowances.
This post is an attempt to draw all of that on one page and put a number on every part of it. The organising question is simple: when two of these instruments touch, what actually passes between them? Sometimes it is a unit — an allowance issued under one system that discharges an obligation under another. Far more often it is only a price, or only an overlap in scope, or a flow of physical energy that moves a tonne of emissions from one system’s account into another’s. Those are very different relationships.
1. Start with the volumes
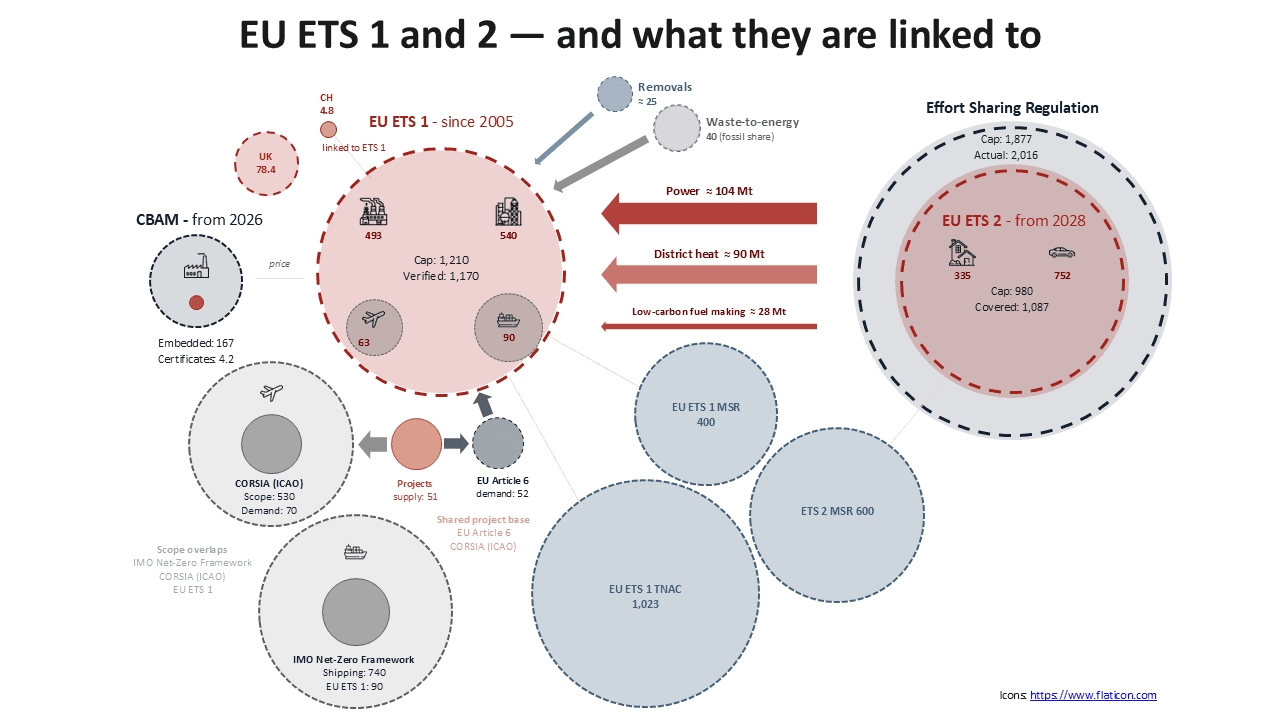
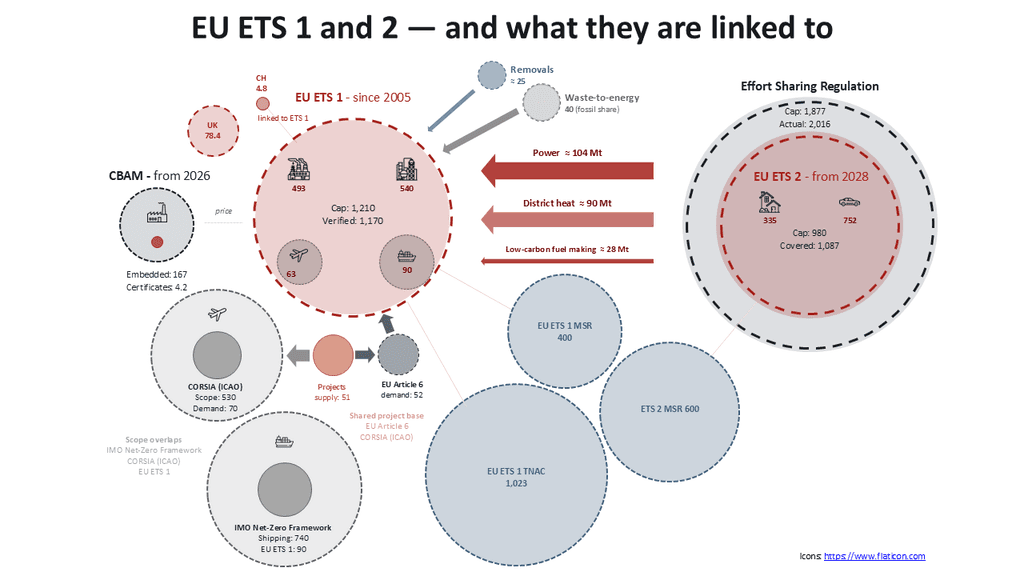
In the accompanying illustration every bubble’s area is proportional to an annual volume in million tonnes of CO₂ equivalent, a dashed outline is a cap — a legal quantity — and a solid fill is actual or estimated emissions. Two things jump out immediately, and neither is obvious from the usual schematic. Power, district-heat and Fuels arrows are now drawn with a thickness proportional to the annual flow they carry, and the banked surplus and the two market stability reserves appear as slate bubbles on the same area scale — stocks of allowances rather than annual flows, so that the buffer can be compared directly with the flow it is meant to absorb.
- In ETS 1, cap and emissions have all but converged. The 2026 cap is about 1,210 Mt. Verified 2025 emissions were roughly 1,170 Mt. For most of the system’s history the cap sat comfortably above annual emissions and the market ran on a surplus; the two lines are now within a few per cent of each other. The figure carries the 2024 sector split on the icons — power and heat 493 Mt, industry 540 Mt, aviation 62.6 Mt, maritime 89.8 Mt — and the banked surplus and reserve as separate stock bubbles on the same area scale, so the buffer can be read against the flow it has to absorb.[1]
- ETS 2 starts on the wrong side of its own cap. Covered emissions in buildings, road transport and small industry were about 1,235 Mt in 2023 and are heading for roughly 1.1 Gt by the end of the decade. The first-year cap, recalculated on verified 2024–2026 emissions with a 5.38% linear reduction factor, lands near 980 Mt. The system therefore opens short by something like 10 to 15 per cent, by design. The 2028 cap itself does not yet exist in law: Article 30c(2) sets it from reported 2024–2026 emissions, published in 2027.[2] [3]
System | Cap 2026 (Mt CO₂e) | Actual / estimated emissions (Mt CO₂e) | Price, 2026 | Relationship to EU ETS 1 |
|---|---|---|---|---|
EU ETS 1 (2005) | 1,210 | ≈1,170 verified (2025) | EUA ≈ €82/t |
|
EU ETS 2 (2028) | ≈980, first year, est. | ≈1,100, est. | EUA2 Dec-28 ≈ €71/t (illiquid) | separate cap, separate unit; joined physically through power and fuels |
Effort Sharing Regulation (2013) | 1,877 (sum of national AEAs) | ≈2,016 (2024) — 1.6% over | no price — Member State obligation | parallel cap over the same sectors as ETS 2 (plus some more); no netting, no unit |
CBAM (2026) | none — uncapped | 167 embedded in covered imports (2024, electricity separate); 4.2 in certificates due for 2026 | certificate €75.36 (Q1), €75.28 (Q2) | price link only; certificates are created on demand, outside the cap |
Switzerland | 4.8 | 5.4 (2023) | ≈ €74/t | linked since 1 Jan 2020 — EUAs and CHUs mutually recognised |
UK ETS | ≈78.4, incl. ≈1.0 domestic maritime | 79.7 (2025, registry) | UKA £58.49 ≈ €67/t | not linked; negotiations opened January 2026 |
Norway, Iceland, Liechtenstein | inside the ETS 1 cap | ≈23 (2024) | EUA | inside ETS 1 through the EEA — participants, not linking partners |
Northern Ireland power | inside the ETS 1 cap | 2.05 (2024) | EUA | inside ETS 1 under the Windsor Framework |
CORSIA (ICAO) | none — baseline-and-offset | ≈530 covered international aviation; ≈70/yr offsetting obligation | eligible units ≈ €10–14/t | no fungibility; overlapping scope, partial cost offset proposed from 2029 |
IMO Net-Zero Framework (not adopted) | none — intensity standard | ≈740 international shipping; EU ETS verified 89.8 (2024) | remedial units US$100 / US$380 | no fungibility; Art. 3gg review trigger only |
Paris Article 6 | n/a | up to 260 total over 2036–40 (≈52/yr), proposed | ITMOs ≈ US$20–40/t | not surrenderable; central EU purchase and cancellation funded by ring-fenced EUA auctions |
2. ETS 1 and ETS 2 are one energy system — and an electrification story
Look at what an ETS 2 obligated entity can actually do. The regulated party is the fuel supplier, but the abatement has to happen at roughly 200 million heating systems and 250 million vehicles, through an estimated 11,400 regulated fuel suppliers. There are three levers: use less energy, burn a lower-carbon molecule, or change the energy carrier.
The first lever — insulation, glazing, controls, modal shift, higher vehicle utilisation — is real and, in buildings especially, large. But it is slow, capital-intensive and paced by renovation rates. The second lever — biomethane, HVO, e-fuels — is volume-limited and expensive; it will matter at the margin and in hard corners like heavy trucking, not at Gt scale in four years. That leaves the third lever, and the third lever is electrification.
Electrification is the mechanism that ties the two trading systems together, and it is worth about 104 million tonnes a year. A heat pump with a seasonal performance factor of 3 replaces roughly one unit of gas heat with a third of a unit of electricity; an electric car replaces a litre of petrol with two to four times less primary energy. In both cases the tonne does not vanish — it shrinks and it moves, out of the ETS 2 account and back under the ETS 1 cap as generation demand. The question is how big that transfer already is.[4] EU-27 buildings and road transport consumed 1,453 TWh of electricity in 2024 — 712 TWh residential, 718 TWh services, 23 TWh road transport — and at the 2024 generation intensity of 213 gCO₂/kWh that is 310 Mt CO₂.
Eurostat’s household end-use series splits residential electricity directly: space heating 113.9 TWh, water heating 81.0 TWh and cooking 88.3 TWh, or 283 TWh of the 712 TWh total — 40%. The remaining 429 TWh is lighting and appliances (391 TWh), cooling (22 TWh) and other. No equivalent official series exists for services; extrapolating the JRC’s end-use shares gives roughly 180 TWh of space heating, water heating and catering out of 718 TWh, with a wide range of 145–215 TWh. Add the 23 TWh of road transport electricity, all of which does substitute for petrol and diesel, and the electricity that has any ETS 2 fuel alternative at all comes to about 486 TWh, or 104 Mt CO₂ — at the 2024 EU generation intensity of 213 gCO₂/kWh — call it 95–111 Mt.[5]
The transfer actually taking place each year is smaller again. Even 486 TWh is a stock, not a flow. Most European electric space heating is decades-old resistive heating; it displaced nothing recently. What moves a tonne from ETS 2 to ETS 1 in a given year is the increment from fuel switching — heat pumps and electric vehicles. Eurostat records 222 TWh of ambient heat captured by EU heat pumps in 2024, which at a seasonal performance factor of 3 implies roughly 110 TWh of electricity, and electric vehicles add 23 TWh. That is about 133 TWh, or 28 Mt CO₂. The illustration carries 104 Mt on the arrow, with the 28 Mt flow noted beside it, because the two answer different questions and both are worth having.
The transfer is small today because electrification is early. The IEA’s June 2026 assessment puts the additional EU electricity demand needed to hit the 2030 electrification target at around 600 TWh, of which about 160 TWh is transport, and it requires annual heat pump sales to nearly triple. On that trajectory the ETS 2-to-ETS 1 transfer grows by an order of magnitude inside five years, which is precisely when the ETS 1 cap has converged with its emissions.[6]
The real fuel-side coupling runs through ETS 1 electricity spent making fuels that are then zero-rated downstream. ReFuelEU Aviation requires 6% sustainable aviation fuel from 2030 and 20% from 2035, with a synthetic sub-mandate of 1.2% averaged over 2030–31 and 5% by 2035. Against EU jet fuel demand of roughly 50 Mt, that is about 0.6 Mt of e-SAF in 2030 and 2.65 Mt in 2035. Power-to-liquid takes something like 25 MWh of electricity per tonne of e-kerosene — Transport & Environment’s[7] own figures imply 15 TWh for the 2030 sub-mandate — so the mandate alone draws 15 TWh in 2030 and 66–93 TWh by 2035. Add the RED III requirement that 42% of industrial hydrogen be renewable by 2030, which implies somewhere between 40 and 194 TWh of electrolysis depending on whether refinery hydrogen counts, and the total is perhaps 130 TWh in 2030 and 260 TWh in 2035. At 213 gCO₂/kWh that is roughly 28 Mt CO₂ in 2030 and 55 Mt in 2035, inside ETS 1, to produce fuel that is counted at zero when it burns.[8]
Which produces a threshold worth committing to memory. Fossil jet fuel emits 3.15 tonnes of CO₂ per tonne. Burning 0.6 Mt of e-SAF instead avoids 1.89 Mt of ETS 1 aviation emissions, at a cost of 15 TWh of electricity. Divide one by the other and e-SAF only reduces total EU ETS 1 emissions if the marginal electricity used to make it is below about 126 gCO₂/kWh. The EU average in 2024 was 213; a marginal gas turbine is around 370. The same calculation for replacing refinery hydrogen — about 40 Mt of ETS 1 emissions today, needing 264 TWh of electrolysis to displace — gives a breakeven of roughly 151 gCO₂/kWh. Both thresholds sit below today’s grid.
The legal channel is narrower than the physics, and narrower than it looks. Renewable fuels of non-biological origin are nominally insulated from this: Delegated Regulation (EU) 2023/1184 requires additionality, geographic correlation and — from 2030 — hourly matching, so compliant electrolysis carries an attributed emission factor near zero. Three carve-outs put it back in ETS 1 anyway. Grids below 18 gCO₂eq/MJ are exempt from additionality; grids above 90% renewable can use grid power without a power purchase agreement at all; and the separate low-carbon fuel route permits pure grid electricity with no PPA while still counting towards the e-SAF sub-mandate, at roughly 30% lower cost. That third route is the cleanest case, because it is the one where grid electricity priced in ETS 1 explicitly produces fuel that is zero-rated in ETS 2.[9]
For now this is a coupling in prospect rather than in fact. The EU supplied 193 kt of SAF in 2024, 0.6% of fuel uplifted, against a 2% obligation from 2025. Not one European e-SAF project has reached a final investment decision, sixteen were paused or cancelled between 2024 and early 2025, and e-SAF costs about €7,700 a tonne against €750 for fossil jet. The July 2026 ETS proposal responds by adding e-fuel distributors to Annex I so that the carbon in synthetic fuels is surrendered at the distribution point — which closes the carbon-utilisation loophole but leaves the electricity coupling entirely intact.[10]
Which produces a specific and slightly uncomfortable conclusion. The cheapest ETS 2 compliance route pushes load onto the tightest market in the system — an ETS 1 whose cap has, as of 2026, converged with its emissions, whose linear reduction factor is 4.3% a year rising to 4.4%, and which is being asked to absorb the electrification of the ETS 2 sectors on top of decarbonising its own. The banked surplus is the shock absorber: 1,023 Mt in the total number of allowances in circulation for 2025, plus the 400 Mt the Market Stability Reserve may hold before the surplus above that level is invalidated. Both buffers are drawn on the figure as separate bubbles on the same area scale as the annual flows, to see their size against the flows they have to absorb: 1,023 Mt of surplus and a 400 Mt reserve against an ETS 1 cap of 1,210 Mt a year, with 190 Mt of that surplus being swept into the reserve between September 2026 and August 2027.ETS 2 gets its own reserve, endowed with 600 Mt in 2027, a year before the system starts.
The „Fuels“ arrow closes the loop in the other direction, and it is worth being precise about what it does and does not double-count. Many ETS 2 obligated entities — refineries, gas suppliers — are themselves ETS 1 installations. A refinery pays ETS 1 on its own process and combustion emissions and, from 2028, ETS 2 on the carbon content of the diesel it releases for consumption. That is the same molecule priced at two points in its life, not the same tonne priced twice. The design is coherent.[11]
On district heating specifically: A building can already be inside ETS 1 rather than ETS 2. EU district heat networks delivered 469 TWh in 2024, 224 TWh of it to households and 106 TWh to services; most of the large plants are above the 20 MW threshold and therefore in ETS 1, so roughly 100–115 Mt of the sector’s ~128 Mt of fossil CO₂ is already capped under ETS 1 and only the small networks fall to ETS 2.
Carbon Removals. The first is permanent carbon removal. COM(2026) 616 proposes a new Article 9c under which up to 250 million allowances are set aside over 2031–2040, auctioned by the Commission, and the proceeds used to buy and permanently cancel CRCF-certified removals — BioCCS (or BECCS) and direct air capture (DACCS) only, with biochar excluded. The cap is raised one-for-one, so removals sit above it rather than inside it, and operators never surrender them; the one exception is a narrow provision letting an operator net its own certified BioCCS against its own fossil emissions. Twenty-five million tonnes a year on average is about 2.5% of the 2031 cap.[12]
The supply problem is severe, and the funding gap is worse. Operating permanent-removal capacity inside the EU-27 is effectively zero. Stockholm Exergi took a final investment decision in March 2025 on an 800 kt BECCS plant at Värtan for start-up in 2028, of which Microsoft has contracted 5.08 Mt over ten years — 500 kt a year, five-eighths of the output. Ørsted’s Kalundborg units are built to capture 430 kt of biogenic CO₂ a year and were targeted to start in 2026, though as of late August 2026 no start-up has been announced. Globally, cumulative durable removals actually delivered by every method in all of history amount to about 1.6 Mt, against roughly 49 Mt contracted — a delivery rate of about 3%. The programme needs 250 Mt. And the arithmetic does not close: auctioning 250 Mt of allowances at €82 raises €20.5 bn, while the International Energy Agency puts first-of-a-kind BECCS at USD 75–300 a tonne and direct air capture at USD 500–1,900, so procurement at even the middle of the BECCS range costs several times that. The proposal’s 10 Mt tranche is not a general contingency but a specific bridge for the gap between the allowance price and the removal price, and it covers only a small fraction of it. Carbon Gap’s sharper objection is that Article 9c commits the Commission to auctioning the allowances but not to procuring an equivalent volume of removals, and that under Article 9c(3) allowances not auctioned for that purpose return to the wider pool — releasing up to 250 Mt with nothing balancing them.[13]
The second inflow is waste incineration. Municipal waste incineration has been under monitoring and reporting since 2024 and would enter the EU-ETS 1 proper on a phase-in: 25% of verified fossil emissions surrendered in 2031, 50% in 2032, 75% in 2033 and 100% from 2034, for non-hazardous plants above three tonnes an hour, with a Member State opt-out to 2035 available on two of three conditions. European waste-to-energy plants emitted around 85 Mt CO₂ in 2024, of which roughly 40 Mt — 47% — is fossil carbon and therefore chargeable; the remaining 45 Mt is biogenic and zero-rated. CE Delft puts the abatement at 4–7 Mt by 2030 rising to 18–32 Mt a year by 2040.[14]
3. Effort Sharing Regulation
There is a third EU cap over the same tonnes. The Effort Sharing Regulation — Regulation (EU) 2018/842, as amended by Regulation (EU) 2023/857 — sets binding national limits for everything outside the ETS 1 installation list: road transport, buildings, small industry, agriculture, waste and the non-CO₂ gases. It covers roughly two thirds of EU domestic emissions, and it is the instrument under which Member States, rather than operators, answer for those sectors.
No official EU-wide total is published — only national Annual Emission Allocations — but summing the 27 figures fixed by Commission Implementing Decision (EU) 2026/895 gives an ESR cap of 1,877 Mt CO₂e for 2026, falling to 1,514 Mt by 2030 against a 2005 base of 2,517 Mt, which is the −40% target. The cap is already being missed: 2024 emissions in ESR scope came in around 2,016 Mt, which the Commission records as 1.6% above the aggregated limit for that year — the first year the EU as a whole has been over its effort-sharing line.[15]
Now the part that changes the picture. The ESR’s scope exclusion is drafted against Annex I of the ETS Directive, which is the ETS 1 installation list. ETS 2 was created in Chapter IVa and Annex III, and Regulation (EU) 2023/857 did not narrow the ESR to match. So, from 2028, fuel combustion in buildings and road transport is covered by both instruments simultaneously. About 60% of the ESR cap is ETS 2 territory — the Commission’s own carve-out puts the 2024 limit for ETS 2 sectors at 1,223 Mt — leaving roughly 930 Mt of agriculture, waste, non-CO₂ gases, rail and domestic navigation outside it. That is why the illustration draws ETS 2 as a circle nested inside the ESR rather than beside it: same tonnes, two caps, and both fills already sitting outside their dashed rings.
The two obligations are not alternatives, because they do not share an addressee.
- ETS 2 is an operator obligation. The fuel supplier buys allowances at a market price and surrenders them, and the cost passes through to the pump and the boiler.
- The ESR is a Member State obligation, settled on the national greenhouse gas inventory. There is no allowance to buy and no price. An excess is multiplied by 1.08 and added to the following year’s total, and the Member State loses the right to transfer allocations. Compliance is checked in 2027 for 2021–2025 and in 2032 for 2026–2030.
So a Member State can be in breach even if every fuel supplier on its territory has surrendered in full, and nothing nets between the two. The Commission’s own framing is that ETS 2 will „complement other policies of the European Green Deal in the covered sectors, helping Member States achieve their emission reduction targets under the Effort Sharing Regulation“ — help, not substitute. Nor do the flexibilities bridge the gap. The Article 6 ETS flexibility runs the other way: nine Member States may cancel EU ETS 1 auction volumes in exchange for additional annual emission allocations, capped collectively at 100 Mt over 2021–2030, of which 64.5 Mt has actually been notified — a figure that fell from 70.6 Mt when Denmark and Luxembourg reduced their use to zero for 2026–2030. The Article 7 LULUCF flexibility, capped at 262 Mt over the decade and split evenly between the two five-year periods, points into land use rather than into either trading system. There is no provision anywhere that turns an ETS 2 allowance into Effort Sharing compliance.[16]
The penalty is where the asymmetry becomes visible. Article 9 of Regulation (EU) 2018/842 provides two consequences and no more. The excess is multiplied by 1.08 and added to the following year’s emission figure — in effect, 1.08 tonnes deducted from next year’s allocation for every excess tonne — and the Member State is temporarily barred from transferring any part of its allocation to another Member State until it is back in compliance. There is no fine. The Effort Sharing Regulation carries no financial penalty at all; enforcement runs through ordinary infringement proceedings under Article 258 of the Treaty, and money only becomes possible at the second stage under Article 259 if a Member State fails to comply with a Court judgment. Compare that with the EU ETS, where an operator that fails to surrender pays an additional penalty of €100 a tonne, indexed to consumer prices since 2012 and therefore materially above €100 today, and still has to surrender the missing allowances. The same tonne is disciplined by a market price on one side of the boundary and by an eight per cent bookkeeping surcharge, checked once every five years, on the other.[17]
On the projected outcome, the Commission’s 2025 assessment has ESR emissions landing at −38% in 2030 against the −40% target, a shortfall of roughly 50 Mt a year. Ten Member States are projected to exceed their allocation in at least one year — Cyprus, Croatia, Italy and Romania in the first period, Austria, Estonia, Germany, Malta, Ireland and Sweden in the second. Whether national targets survive after 2030 at all is the subject of a Commission proposal due in the fourth quarter of 2026.
4. CBAM: a price link, not a volume link
CBAM entered its definitive regime on 1 January 2026 for iron and steel, cement, aluminium, fertilisers, electricity and hydrogen. Embedded emissions in covered imports ran to about 167 Mt CO₂e in 2024 — steel 103, aluminium 38, fertilisers 18, cement 8, with electricity reported separately — which is a seventh of ETS 1’s annual emissions and, drawn to scale, a small bubble beside a large one. The certificates actually due are smaller still: the phase-in rate is 2.5% in 2026, so roughly 4.2 Mt, rising in steps to 100% in 2034 as free allocation is withdrawn (the Directive’s CBAM factor is the mirror image — the free allocation retained, 97.5% in 2026).
CBAM has no effect on the ETS 1 volume; CBAM hedging is volume-neutral
A CBAM certificate is not an EU allowance. There is no cap on certificates; the Commission and Member States may not restrict or delay their sale; they are created in a declarant’s account once payment clears; and surrendering one consumes no EUA. CBAM sits outside the ETS 1 cap in the strict accounting sense, and the cap is unchanged by its existence.
Three channels nonetheless move the ETS 1 balance.
- The phase-in is a transfer of cash, not of volume. Every step withdraws free allocation from EU installations in the covered sectors — 2.5% in 2026, 10% in 2028, 48.5% in 2030, 100% in 2034 as the law stands. Under Article 10a(1a) of the ETS Directive the withdrawn allowances are neither cancelled nor handed to Member States: they go to the Innovation Fund, which monetises them through the same EEX auctions. So the allowances come back to the market in full. Net supply is unchanged, net demand is unchanged, and — because Article 1(4) of the Market Stability Reserve Decision counts free allocation and auctioned volumes symmetrically as „allowances issued“ — the total number of allowances in circulation is unchanged too, and with it the reserve’s intake and invalidation. There is no bullish or bearish supply event here at all. What changes is who pays cash for what: an installation that used to receive a tonne now buys it. That is a working-capital and cost-incidence effect on the industry, and a revenue transfer from national budgets to the EU Innovation Fund — nothing more. The one genuine second-order channel is a timing artefact: free allowances enter the circulation count when they are issued in February, Innovation Fund allowances only when they are actually auctioned, so any lag temporarily depresses the count, shrinks the reserve intake and, above the 400 Mt line, reduces invalidation.
- CBAM does not create tonnes; it stops tonnes leaving. Which, under a binding cap, is a price story rather than an emissions story. CBAM’s purpose is to keep carbon-intensive production in Europe, and production that stays emits under the ETS 1 cap. Against a counterfactual of the same carbon price with no CBAM, the Commission’s own impact assessment (SWD(2021) 643) has EU emissions in the covered sectors falling by 44.0 Mt with CBAM versus 58.9 Mt under full auctioning without it — so CBAM leaves between 3 and 12 Mt more inside the EU in 2030 than the no-CBAM case, with no inward relocation assumed anywhere in the model. But that is avoided offshoring, not new industry. And if the cap binds, those extra tonnes cannot show up as emissions at all: they show up as a higher allowance price. [18]Bellora and Fontagné[19] put that at +5.2% to +14.1% on the EUA, with EU emissions unchanged by construction. Only models without a hard cap — Rocchi and Elkerbout’s[20] FIDELIO run, which finds EU steel and cement output up 1.5–2.0% and EU emissions „rising slightly“ by 2040 — show emissions moving.
- And is reshoring actually expected? On the evidence, no. No published model puts EU covered-sector output above its no-policy baseline; the Commission’s most protective option merely keeps output „at baseline levels“. ERCST’s own July 2026 modelling — funded by Eurofer, Cement Europe and FertilizersEurope — finds the number of efficient EU upstream sites rising sharply if CBAM is introduced without phasing out free allocation, but returning „toward its initial level“ under the policy as actually legislated, with downstream EU production falling in both scenarios. There is not one documented investment decision publicly attributed to CBAM: Hydro’s Slovalco restart in July 2026 was announced on the back of a Slovak electricity and indirect-cost agreement, and Alcoa’s San Ciprián restart cites power, not carbon. What CBAM does visibly do is pull low-carbon capacity toward the EU market while it stays outside the EU — roughly 5 Mt/yr of new Algerian direct-reduced iron aimed at Europe is the clearest example. CBAM may prevent an exit it does not reverse.[21]
- Hedging the CBAM price with EUAs is volume-neutral. CBAM-Certificates themselves cannot be traded between declarants or borrowed, and can only be sold back to the Member State at the original purchase price, capped at the number the declarant was obliged to buy that year. So an importer that wants to fix its cost hedges in the EUA market instead. But it can never surrender those EUAs: it has no compliance obligation. Every allowance it buys it must sell again, and in the structure that actually makes sense it sells them precisely into the window that sets the CBAM price. The position opens and closes; no allowance is retired; the cap, the circulation count and the reserve are all untouched. The only residue is transient open interest and a little extra demand for forward liquidity — real for a market maker, invisible to the cap.
CBAM and EU ETS 1 prices are equivalent – effective charges are not
By construction the two prices are close. The certificate price is the weighted average of EU ETS 1 auction clearing prices — four quarterly prices in 2026, weekly from 2027. Published so far: €75.36 for Q1 2026 and €75.28 for Q2. Over the same period spot EUAs ranged from about €92 in January to about €72 in April and stood at about €82 in mid-August; the 2025 average was €73.43 at auction and €74.35 on the secondary market. So the CBAM price is a lagged, averaged, auction-only proxy for a more volatile secondary market. In a rising market the importer underpays relative to the EU producer’s marginal cost; in a falling one, it overpays.[22]
Can an importer simply replicate the formula? Largely yes — and this is the most interesting mechanical point in the whole instrument. The structure works like this: when it starts producing goods destined for the EU, the importer buys EUAs; it then sells them back across the reference window that defines the CBAM price for the relevant import period, so its realised average sale price tracks the published certificate price. Article 21 of Regulation (EU) 2023/956 and Implementing Regulation (EU) 2025/2548 make the benchmark a volume-weighted average of auction clearing prices — quarterly for 2026, weekly from 2027 — and the auction calendar is published in advance. A quarter contains about 58 auctions across the common and opt-out platforms, so a volume-weighted programme executed against that calendar is a static hedge with known weights.
How close does it get? Close enough. The auction-to-secondary basis has compressed to a mean absolute 0.10% in the second quarter of 2026 — around €0.08 a tonne — on the German auctioneer’s own published series, with a worst single print of €0.90. Execution tracking error across 58 observations is on the order of €0.05 to €0.15. Averaging works in the hedger’s favour rather than against it: at roughly 29% annualised volatility, a quarterly average has a standard deviation near 8% against 14.5% for a point-in-time price, and a weekly average about 2.3%. Add it up and the price leg tracks to something like ±€0.10–0.30 a tonne, or 97–99% hedge effectiveness.
What breaks it is not the averaging. Three things. First, in 2026 the price attaches to the quarter of release for free circulation, not to production or shipment, and a mis-attributed quarter costs €4–10 a tonne — twenty to a hundred times the execution error — so the hedge has to be sized by expected customs clearance date, not by bill of lading. From 2027 that risk largely disappears, because the weekly price attaches to the week in which certificates are bought, which the declarant chooses. Second, carry: the December-2026-to-December-2027 spread runs about 140 basis points above the risk-free rate, so holding the hedge costs roughly €0.7–1.1 a tonne per quarter of tenor. Third, an importer cannot bid at the auctions that define its own benchmark: Article 18 of Delegated Regulation (EU) 2023/2830 limits direct bidders to operators, investment firms, credit institutions and business groupings, so it must trade the secondary market or bid through a bank. None of this is prohibitive — a Union Registry trading account is open to any person, and an importer holding spot allowances and exchange-traded futures passes the MiFID II ancillary activity exemption comfortably and sits below the market-abuse disclosure thresholds.
The catch is that in 2026 none of this is worth doing. At a 2.5% phase-in rate the net exposure is about €1.88 per tonne of embedded CO₂, roughly €3.75 per tonne of blast-furnace steel. Carry alone can exceed the entire variance being hedged. The trade becomes worth its operational and legal overhead somewhere around 2029–2030, when the phase-in rate reaches 22.5% and then 48.5% — later still if COM(2026) 616 passes and stretches the schedule to 2038.
- The CBAM factor. In 2026 an importer pays 2.5% of €75, which is about €1.90 per tonne of embedded CO₂. An EU producer pays the full EUA price on emissions above its product benchmark. Comparing €75 with €82 and concluding „equivalent“ misses the arithmetic by a factor of forty. The two converge only as free allocation reaches zero — and COM(2026) 616 now proposes to reintroduce 15% of the phased-out free allocation from 2028 and stretch the endpoint from 2034 to 2038, which would push convergence out by four years. There is an objection to leaning on this: if free allocation is an opportunity cost, the actual benefit should not affect marginal decisions at all, and the EU producer should be facing the full €82. EU free allocation is not a fixed grant: Implementing Regulation (EU) 2019/1842 leaves allocation untouched while activity stays within ±15% of the historical level, then resets it by the full percentage deviation, with further 5% steps beyond that, zero on cessation, and pure output-based allocation for a new entrant’s first two years. Inside the dead band the opportunity-cost argument holds exactly and the marginal carbon price is the full EUA price — which is why [23]Zaklan’s[24] natural experiment on the power sector finds the independence property surviving. At the boundary it fails, and it fails hard: for a one-million-tonne clinker installation at €80, crossing the −15% threshold costs about €8.3 m in one step, so lifting output to stay inside the band can be worth roughly €5 m net — an implicit marginal subsidy of about €100 a tonne of clinker, with the opposite sign to the carbon price. Branger and co-authors [25]measured roughly 6.4 Mt of excess EU clinker in 2012, about 5% of output, achieved partly by raising the clinker-to-cement ratio. On the wider question the comment raises — whether free allocation really incentivises investment in Europe, and whether its phase-out removes that incentive — the Commission has now taken the sceptical side itself, writing in COM(2026) 616 that free allocation „has not been conducive to driving transformational change“. ERCST’s own numbers[26] agree from the other direction: removing free allocation multiplies blast-furnace steel’s ETS cost roughly eightfold and still leaves hydrogen steel about 50% more expensive.
- The measurement base. An EU installation pays against verified, installation-level emissions net of a benchmark. An importer pays against embedded emissions from actual data or, failing that, country-and-product default values marked up by 10% in 2026, 20% in 2027 and 30% from 2028 (fertilisers only 1%). A deliberately punitive default is not the same base as a benchmark, and for importers with weak data it is a higher one. Read the other way round, though, that is the point of the design rather than a defect in it: the mark-up is an information incentive, and an importer that measures and verifies properly is simply not exposed to it. The evidence is that it works. Reporting on actual values rather than defaults rose from 8–11% of declarations in 2023–24 to 53% by the second quarter of 2025.[27]
- Risk management. EU producers manage multi-year EUA exposure on a liquid forward curve with banking. The importer hedges a payment it cannot bank, cannot trade and can only unwind through a capped repurchase at the original price, so it carries the hedge on its own balance sheet and pays roughly €0.7–1.1 a tonne per quarter of tenor for the privilege. Same expected price, different cost of capital and more operational overhead — which for a mid-sized importer facing a €1.88 charge in 2026 is a reason not to bother.
- Scope asymmetry. Cement and fertilisers include indirect (electricity) emissions; steel, aluminium and hydrogen do not. EU producers meet the carbon cost of their power through the electricity price, partly offset by indirect cost compensation. The perimeters do not match sector by sector. The order of magnitude is worth having. The OECD’s assessment of CBAM on 2022 trade volumes puts about 24% of covered embedded emissions in Scope 2 and 3 — indirect and upstream — which against the 167 Mt of embedded emissions reported for 2024 is roughly 40 Mt sitting on the wrong side of the perimeter line for the sectors where indirect emissions are excluded. Imported electricity is the other piece: it is reported separately from the 167 Mt, at about 86 Mt cumulatively over the fourth quarter of 2023 to the second quarter of 2025.
Incentive to move CBAM-relevant production out of Europe
- Exports. CBAM covers imports only. EU production sold outside the EU carries a European carbon cost into markets where competitors carry none, and as free allocation is withdrawn that disadvantage grows in step. A producer serving both the EU and third markets has a clean arbitrage: move the plant, pay CBAM on the EU-bound share, pay nothing on the rest. The Commission declined an export rebate on WTO compatibility grounds and offered a Temporary Decarbonisation Fund instead (COM(2025) 990, 17 December 2025), financed from 25% of 2028–29 CBAM revenue and still in trilogue in mid-2026. Restoring 15% of free allocation from 2028 is the other half of the answer. Neither is a rebate.
- Downstream goods. CBAM covers six upstream commodities. Move the fabrication step out and import the finished fastener, the wire, the heat pump, the wind tower rather than the steel, and the charge disappears entirely — no ETS, no CBAM. This is not a theoretical loophole; it is the cheapest available arbitrage today, and it is why the Commission proposed extending CBAM to roughly 180 downstream products from 1 January 2028 (COM(2025) 989 of 17 December 2025), with Parliament pushing for more in July 2026: roughly 180 steel- and aluminium-intensive downstream products from 1 January 2028, plus anti-circumvention powers and dealing with pre-consumer scrap. The Council agreed a general approach on 12 June 2026 and the Parliament’s environment committee adopted its position on 6 July by 56 votes to 11, widening the „slightly modified goods“ test, adding e-commerce rules and removing the option to count Article 6 credits against CBAM obligations; the plenary mandate is scheduled for 14 September 2026. So: still open in law, on track to be partly closed from 2028. Even then it covers only the steel and aluminium precursor emissions, not the energy used to fabricate the goods; passenger cars stay out; indirect emissions and the chemicals and polymer chains are deferred to a 2027 review; the 50-tonne threshold exempts a great deal of finished product; and the export leg is untouched. The Commission’s own modelling puts the whole extension at 0.8 Mt of global abatement by 2035 — about 0.002% of global CO₂ — which tells you it is a leakage-plugging measure, not a climate measure.[28]
- Resource shuffling. Because CBAM accounts at installation level, a multinational can route its cleanest plant’s output to Europe and its dirtiest elsewhere, at unchanged global emissions and no relocation at all.
Against those, the frictions — and here the literature deserves citing rather than gesturing at. Relocation decisions are lumpy, capital-intensive, twenty-year commitments made against a carbon price that has traded between €52.21 (23 February 2024) and €100.34 (21 February 2023) on a front-December settlement basis in the last four years — and note that the widely repeated €105.73 high is a contract-for-difference quote, not an exchange print. Carbon is a modest share of total cost for most CBAM goods. Cement barely travels: Cement Europe’s own figure is that it is cheaper to cross the Atlantic with 35,000 tonnes than to truck it 300 km, which is why extra-EU imports were still only about 8–10% of EU consumption in 2025, up from roughly 1.5% in 2016. Primary aluminium is an electricity story, not a carbon story: European Aluminium puts power at 30–45% of production cost, and Sartor’s study[29] of 6.5 years of the ETS concluded that electricity prices, not CO₂ costs, drove the rise in EU net imports — the sector also draws state-aid indirect cost compensation under the 2020 ETS state-aid guidelines. On leakage itself, Verde’s 2020[30] survey in the Journal of Economic Surveys found no evidence of significant carbon leakage; Dechezleprêtre and co-authors[31] found none within 1,122 multinationals; Naegele and Zaklan[32] found no increase in net imports in value or embodied carbon; Branger, Quirion and Chevallier [33]found no effect of the carbon price on cement and steel net imports. The honest caveat is that this evidence is mostly from the low-price phases, and the newest synthesis complicates it: Chen, Di Gregorio and Paavola’s 2026[34] meta-analysis in Climate Policy reports ex-ante modelled leakage rates from −8% to 90% and does find ex-post leakage in specific channels, including investment relocation in the EU ETS 1, while remaining mixed-to-null on goods trade and within-firm transfers. For calibration on the aviation side, the ICCT’s July 2026 study [35]puts leakage from a full EEA-departing ETS at 1.9% of in-scope emissions, about 2.4 Mt, two thirds of it hub-switching through Istanbul. (Carbon costs are the author’s arithmetic at EUR 82 per tonne on the intensities cited; material prices are indicative 2026 European levels.)
5. Steel, aluminium or plastic? What the carbon rules do to material choice
Put the three structural materials side by side and the carbon rules treat them very differently — not by design, but as a by-product of which sectors happened to be in CBAM’s first tranche and where in the life cycle each material’s carbon is released.
| Steel | Aluminium | Plastics (commodity polymers) |
|---|---|---|---|
Cradle-to-gate intensity | 1.9 t CO₂/t (blast furnace); 0.36 (scrap EAF) | 6.8 t CO₂e/t (EU primary, incl. electricity); ~16 global average; 0.5 recycled | ≈2 t CO₂/t at the factory gate |
Carbon released at end of life | None (recycled) | None (recycled) | ≈2.7 t CO₂ per tonne burned |
ETS product benchmark | 1.288 hot metal; 0.215 EAF | 1.464 (direct only) | No single benchmark; refinery and chemicals benchmarks apply upstream |
EU volumes | 126–129 Mt crude steel; ≈96 Mt in ETS 1 | Primary output collapsed, >50% of capacity idled since 2021 | 54.6 Mt produced (EU-27+3), 43.3 Mt fossil-based |
Embedded emissions in imports (2024) | 103 Mt | 38 Mt | Not measured — outside CBAM |
In CBAM? | Yes, from 1 Jan 2026 | Yes, from 1 Jan 2026 | No — deferred to a “step two” review in 2027 |
Waste incineration in ETS 1 | Not applicable | Not applicable | Yes — 25% of fossil CO₂ from 2031, 100% from 2034 |
Gross carbon cost at €82/t | ≈€156/t of steel | ≈€558/t of primary aluminium | ≈€164/t at the factory gate, plus ≈€221/t at incineration |
Steel and aluminium release their carbon while they are being made, inside Europe, in an installation that holds an ETS 1 permit — and when they are made abroad instead, CBAM charges the importer at the border. The carbon and the charge travel together. Plastics do not work like that. Only part of a polymer’s carbon is released during manufacture; most of it stays locked in the material and is released years later, when the product is burned in a waste-to-energy plant. From 2031 that incinerator starts paying the ETS 1 on the fossil share of what it burns, and the cost is passed back through to whoever put the waste in the bin. But an importer of polymer pays nothing at the border, because plastics and organic chemicals sit outside CBAM.
So the same tonne of carbon is treated in different ways depending on which material it arrives in. A tonne of steel imported into the EU is charged once, at the border, in proportion to how dirtily it was made. A tonne of imported plastic is charged once too — but at the end of its life, in Europe, on the incinerator, at a rate that has nothing to do with how it was manufactured or where. European polymer producers therefore face both charges and importers face only the second. Sandbag’s estimate is that chemicals and refineries account for a little over a third of EU ETS industrial emissions and are almost entirely outside CBAM, and that even for ethylene and polyethylene (which would capture 39–60% of production emissions).
Does that move material choice? Probably not much, and here is the arithmetic. At €82 a tonne, the gross carbon cost is about €156 per tonne of blast-furnace steel, €558 per tonne of European primary aluminium, €164 per tonne of polymer at the factory gate and a further €221 per tonne at incineration. Those look large until you net off free allocation, which in 2026 still covers 97.5% of the benchmarked quantity: an efficient EU steelmaker’s net exposure is a few euros a tonne, not €156. Set against material prices of roughly €600–700 for steel, €2,400–2,800 for aluminium and €1,000–1,500 for commodity polymers, carbon is currently a low single-digit percentage of cost for all three. Substitution between structural materials is driven by strength, weight, formability, corrosion and tooling, and it happens on vehicle-programme and building-code timescales measured in years. A carbon differential of one or two per cent of material cost does not move it.
What is at stake is a different and larger number. Adding it up: about 96 Mt of ETS 1 emissions from iron and steel, roughly 55–60 Mt from chemicals, some 10 Mt of direct aluminium emissions with a much larger indirect footprint inside the power sector, 141 Mt of embedded emissions in steel and aluminium imports now inside CBAM, and 40 Mt of fossil CO₂ at waste-to-energy plants arriving from 2031. That is well over 300 Mt a year of carbon whose treatment differs by material and by where in the life cycle it sits — against a total ETS 1 cap of 1,210 Mt. The distortion is not currently large enough to change what engineers specify. It is easily large enough to change where polymer capacity gets built, which is the same argument as the downstream-goods loophole in the previous chapter, one material further along.[36]
6. The systems that share the unit — and the ones that only look like they do
Article 25 of the ETS Directive sets three conditions for linking: the partner system must be mandatory, must have an absolute emissions cap, and must be compatible — in practice, comparable registries, monitoring, enforcement and ambition, including similar limits on offsets. Exactly one system meets them today.
Switzerland has been linked since 1 January 2020. EU operators may surrender Swiss allowances and Swiss operators may surrender EUAs; the registries stay separate but are connected to the Union Registry with daily transfers, and a Joint Committee manages the relationship. The Swiss cap for 2026 is 4.8 Mt (3.75 Mt stationary plus 1.06 Mt aviation) against 5.4 Mt of covered emissions, so the system is structurally short and Switzerland is a net importer of EUAs — which is why the Swiss price tracks the European one by construction. At 0.4% of ETS 1’s volume this matters for the precedent, not the tonnage. It also shows how long the precedent takes: mandate in 2011, talks concluded 2015, signature 2017, operation 2020.
The UK ETS is the one to watch, and it is not linked. Its 2026 cap is about 78.4 Mt including the roughly 1.0 Mt added for domestic maritime, which went live on 1 July 2026; registry-reported 2025 emissions were 79.7 Mt, helped by the closure of the Port Talbot blast furnaces. That is a system with ETS 1’s architecture at a fifteenth of its size. The May 2025 EU–UK Common Understanding committed both sides to work towards linking, with mutual recognition of allowances and mutual CBAM exemption, on terms the UK has already conceded: dynamic alignment with EU rules, a financial contribution, and the Court of Justice as ultimate authority on questions of EU law. The Council agreed a negotiating mandate on 13 November 2025 and talks opened in the week of 19 January 2026. By July 2026 the reported sticking points were free allocation and the level of the UK cap, and the summit at which a deal was to be announced had been postponed. Nothing is signed and there is no official target date.
The spread is the price of not being linked. On 19 August 2026 a UKA cost £58.49, roughly €67, against €81.57 for an EUA — a discount that has ranged from about €7 to about €22 during 2026 and that moves on linkage headlines rather than on UK fundamentals. Meanwhile UK industry puts its EU CBAM exposure at around £800 m a year, the Commission has declined an interim exemption before a link exists, and the UK’s own CBAM starts on 1 January 2027 under Part 5 of the Finance Act 2026, indirect emissions deferred to 2029 at the earliest. From 2027 there are two border adjustments pointing at the same trade flows across the same sea.
And a distinction that is routinely got wrong: Norway, Iceland and Liechtenstein are not linked to the EU ETS. They are in it, through the EEA — same rules, same Union Registry, same auction regime, roughly 23 Mt between them in 2024. Six Northern Ireland power stations (2.05 Mt) likewise remain directly inside ETS 1 under the Windsor Framework, to keep the all-island Single Electricity Market intact. On the illustration these belong inside the ETS 1 bubble, not beside it.
Further out on the perimeter, Türkiye’s Climate Law No. 7552 of July 2025 established the legal basis for a Turkish ETS with a pilot from 2026, Ukraine published a draft ETS law on 19 May 2026, and Montenegro’s system covers what is now a single operating installation. None is linkable today — Türkiye’s pilot appears to be intensity-based rather than absolutely capped, which fails Article 25 on its face — and all of them are moving because of CBAM rather than because of linking. That is worth noting on its own: CBAM has become the EU’s most effective carbon-market export policy, and it works by pricing rather than by linking.
7. CORSIA and IMO
Neither CORSIA nor IMO is a cap and neither unit is fungible with an EUA. They are large scope bubble with a small obligation bubble inside it, sitting outside the EU cap, connected to ETS 1 by overlapping scope rather than by any flow of units.
CORSIA is baseline-and-offset, not cap-and-trade. The baseline is 85% of 2019 emissions; growth above it must be offset with eligible units. 130 states participate voluntarily as of 1 January 2026, and participation becomes mandatory for most from 2027. The 2024 sector growth factor of 15.4% produced an offsetting requirement of 55.6 Mt; IATA’s mid-case for 2025 is about 70 Mt; the whole first phase comes to 170–236 Mt. Against that, authorised supply stood at roughly 51 Mt in July 2026, about half of it a single jurisdictional REDD+ programme in Guyana, with only seven host countries having issued letters of authorisation. The binding constraint is authorisation and corresponding adjustments, not underlying credit volume. Units traded around US$11–15 in mid-2026, having been US$19–23 in 2024–25 — a small fraction of an EUA.
The EU interaction is more interesting than the usual „either/or“ framing suggests. „Stop the clock“ has confined ETS 1 aviation to intra-EEA flights plus departures to the UK and Switzerland, and runs to 31 December 2026. The Commission’s Article 28b assessment of 17 July 2026 found CORSIA’s conditions unmet — voluntary coverage around 51%, falling to about 35% if the United States and China opt out, and 70% of eligible credits carrying high integrity risk with none rated low risk. Rather than extend the ETS 1 to all extra-EEA flights, COM(2026) 616 proposes a targeted extension for 2029–2032 to departures for airports within 5,000 km of Frankfurt, with a review in 2032. In that band — Istanbul, Dubai, Riyadh, North Africa, the Levant — an operator would face both CORSIA cancellation and EUA surrender, mitigated not by exempting either but by a new fixed-deduction benchmark. Since EUAs cost several times what eligible units cost, airlines would effectively pay the ETS 1 price.
One volume trap worth flagging: ETS 1 issues about 24.9 Mt of aviation-specific allowances in 2026, but verified in-scope aviation emissions were 62.6 Mt in 2024, and all aviation departing European airports is on the order of 195 Mt. Aviation is a net buyer from the general ETS 1 pool. The aviation cap number is not the aviation coverage number. All three numbers are now on the figure as nested bubbles — the 24.9 Mt aviation cap, the 62.6 Mt verified in scope, and the wider departing total — so the gap is visible rather than asserted. One correction to the wider figure while we are here: 195 Mt is the T&E and Eurocontrol estimate for all flights departing EU31 airports in 2025, whereas the ICCT’s modelled in-scope total for an all-departures ETS is 128.8 Mt on 2023 traffic. The figure uses the ICCT basis.
The IMO belongs on the chart as a dashed, unadopted outline. The Net-Zero Framework was approved at MEPC 83 in April 2025 and then not adopted: the extraordinary session of October 2025 voted 57 to 49 to adjourn for a year, under heavy US pressure and with China switching from support to delay. MEPC 84 in spring 2026 preserved the framework as the basis for negotiation and added two intersessional meetings; the next decision point is the resumed session on 4 December 2026, alongside MEPC 85. Its design is a declining well-to-wake GHG fuel intensity standard for ships of 5,000 GT and above, with two-tier remedial unit prices of US$100 and US$380 per tonne CO₂e — fixed only for 2028–2030 — feeding an IMO Net-Zero Fund. That is a price instrument, not a cap — and at the upper tier a price several times the EUA.
The scale gap is the point. International shipping emits roughly 740 Mt CO₂ on the Fourth IMO GHG Study basis; the EU ETS verified 89.8 Mt of maritime emissions in 2024, about an eighth of the sector, and only 70% of 2025 emissions are actually surrendered under the phase-in, with the difference cancelled rather than banked. Article 3gg of the Directive obliges the Commission to review the ETS within eighteen months of an IMO measure being adopted and before it becomes operational. There is no agreed mechanism for netting an IMO remedial unit against an EUA, so if both ever apply, ships pay under both, with FuelEU Maritime as a third layer. The postponement at the IMO changes nothing about EU obligations.
8. Paris Article 6: the link that runs through the cap, not through the market
Article 6 units cannot be surrendered in the EU ETS 1, and the current proposal does not change that. International credits were eligible in the EU ETS 1 until 2020 and have been excluded since 1 May 2021, with unused entitlements extinguished.
What changed sits upstream of the market. The amended European Climate Law, adopted by the Council on 5 March 2026, sets a binding −90% net target for 2040 against 1990 and allows high-quality international credits to contribute up to 5% — measured against 1990 net emissions, not against the 90-point reduction itself — from 2036, with at least 85% achieved domestically. The Commission had proposed 3%; the co-legislators raised it. COM(2026) 616 then translates a slice of that headroom into ETS 1 mechanics in an indirect way.
- Up to 260 million allowances — roughly 52 Mt a year — are ring-fenced from the system-wide quantity and auctioned over 2036–2040.
- The proceeds are assigned revenue funding a central EU purchasing facility that buys Article 6.2 ITMOs meeting Union integrity, permanence and corresponding-adjustment standards.
- Those ITMOs are cancelled permanently. Operators never see them, never hold them and never surrender them.
- The purchase programme is what buys a softer post-2035 linear reduction factor of 1.7% instead of 2.7%. If the Commission determines by January 2033 that high-integrity supply cannot be secured at scale, the programme is cancelled, the LRF reverts to 2.7% and the allowances are redirected to the Industrial Decarbonisation Bank.
Allowances are auctioned, cash leaves the system, credits are cancelled outside it, and what changes is the cap trajectory. It is a link between the EU’s target and the international market, intermediated by the state.
Whether the supply exists is a genuine question, and the numbers need stating carefully because two different pools are easily confused. Two years after the COP29 standards, the Paris mechanism has one native methodology — landfill gas, approved in October 2025 — and has issued 1.11 Mt in total, all of it from two Myanmar cookstove programmes. Article 6.2 has over 100 bilateral arrangements across more than 50 host countries, but only 64,808 units have actually been received by an acquiring Party. Prices are negotiated rather than quoted, spanning roughly US$10 to US$40 with Swiss purchases at the top end; there is no liquid market and no published index.
Set that against what the EU proposes to buy. The EU’s programme aims at 260 Mt over 2036–2040, an average of 52 Mt a year. Cumulative supply authorised for use in CORSIA stood at roughly 51 Mt in July 2026 — in total, not per year — about half of it a single Guyanese jurisdictional REDD+ programme, from 24 host countries that have published 67 letters of authorisation, of which only five have reported the corresponding adjustments. On the wider Article 6 picture the World Bank counts about 270 Mt unilaterally authorised and 43.5 Mt issued across 12 host countries. So, the EU would need, every year for five years, roughly as much authorised supply as has ever been issued under Article 6 in total. The comparison sometimes made with „a full year of global high-integrity supply“ refers to the much larger CCP-labelled voluntary market, not to the authorised Article 6 pool. The pipeline is large — 57 Mt a year of planned Article 6.2 mitigation and an 800 Mt/yr aspiration under the Paris mechanism — but a pipeline is not supply, and issuance is running three orders of magnitude below it.[37]
And the competition is not a coincidence of timing; it is the same legal instrument. A CORSIA-eligible unit requires the host country to attest to the avoidance of double claiming, and ICAO’s own guidance states that this attestation has „the same meaning“ as an authorisation under Decision 2/CMA.3 — the Article 6.2 authorisation. Add the requirement that the corresponding adjustment be reflected in the host country’s biennial transparency report, and a tonne sold to an airline is a tonne that has left both the host country’s own target and the sovereign Article 6 pool[38]. The scale of the contest: on [Sylvera’s]()[39][\MW2\] decomposition, demand for correspondingly adjusted credits to 2030 runs to about 915 Mt, of which CORSIA is 610 Mt against roughly 305 Mt of sovereign Article 6 demand from Japan, Singapore, Switzerland, Korea, Norway and Sweden. The EU’s 260 Mt then arrives on top of that from 2036, which [AlliedOffsets]()[40][\MW3\] puts at about 78% of all tracked demand for 2040, and [EDF and The Nature Conservancy]() [41][\MW4\] expect the EU to account for a third to a half of demand in that window — their conclusion being that „the EU cannot rely on a spot credit market to provide credits as there will not be sufficient supply“. Host countries are already rationing: Kenya has said it will authorise up to 10 Mt through 2030 against a modelled potential of about 30 Mt, on the explicit ground that authorising more would cannibalise its own target.
9. What the picture actually tells you
- Only one line transfers a unit. Switzerland. Everything else on the chart is a price relationship, a scope overlap, or a state-mediated flow. When public debate says „linked“, it almost always means „correlated prices“, which is a much weaker property — and one that can be undone by a postponed summit.
- Three EU caps sit over the same tonnes, and two of them over the same sectors. ETS 2’s cheapest compliance route is electrification, and electrification loads ETS 1 — whose cap has, in 2026, converged with its emissions — at roughly 310 Mt of power and 90 Mt of district heat a year already, while about 730 Mt of ETS 2’s own carbon passes through an ETS 1 refinery on its way to the burner. And the whole of ETS 2’s scope also sits inside the Effort Sharing Regulation, whose 1,877 Mt cap is a Member State obligation with no price attached and no netting against ETS 2. The banked surplus is what makes the transfer survivable, and it is being drawn down.
- A cap without a price behaves differently from a cap with one. The clearest evidence in this whole picture is the Effort Sharing Regulation: its 2030 environmental target is projected to be missed by about two percentage points, while the accounting is expected to balance through transfers between Member States. ETS 2 puts a price on part of the same tonnes without replacing that obligation. Whether the two instruments are eventually merged is a question for the post-2030 framework proposal due at the end of 2026 — there is no proposal on the table today.
- CBAM keeps the cap intact and puts all the action in the perimeter. Not in the equalised import charge, but in exports, downstream goods, resource shuffling and the free-allocation phase-out schedule — which the July 2026 proposal has now reopened.
- There is no single European carbon price. In August 2026 the same molecule of CO₂ costs about €10–14 as a CORSIA-eligible unit, €67 as a UKA, €75 as a CBAM certificate, €82 as an EUA, and a proposed US$100 or US$380 as an IMO remedial unit. The spread between those numbers is where behaviour actually gets decided. And the four-year range for the EUA itself, since the draft quoted it loosely: €52.21 to €100.34 on front-December settlements, not €49 to €106.
- Almost every forward-looking number here is a legislative variable. ETS 2’s start already moved by a year. The cap that was going to reach zero in 2039 is now proposed to run into the 2040s. The CBAM phase-out that ended in 2034 is proposed to end in 2038. Read any date after 2027 on this chart as a proposal, not a plan — and expect to redraw it.
Note on the illustration / Figure 1
Bubble areas are strictly proportional to annual volume in Mt CO₂e on a single scale across the whole chart, so a bubble four times the area of another represents four times the tonnage. Dashed outlines are caps — legal quantities — and solid fills are actual or estimated emissions; where a fill sits outside its ring, emissions exceed the cap. Solid double arrows mark mutual recognition of allowances, dotted arrows mark a price link with no unit transfer, and the absence of an arrow means separate units and separate obligations. ETS 1’s 2025 verified total is derived from the Commission’s published −1.3% change; ETS 2’s first-year figures are modelled; CORSIA’s and the IMO’s outer bubbles are sector scope rather than obligation, with the obligation nested inside. Arrow thickness is proportional to volume linearly rather than by area, which is the ordinary Sankey convention; the two encodings are stated on the figure so they are not read against each other. Stocks — the surplus and the two reserves — are drawn on the bubble scale but coloured slate and labelled as stocks, because comparing a one-off buffer with an annual flow is exactly the comparison worth making and exactly the one most easily misread. The Effort Sharing Regulation and EU ETS 2 are drawn concentrically because the second is a subset of the first; the flow estimates are derivations from Eurostat, Ember and Fuels Europe data rather than published statistics, and the district-heat figure in particular carries a 65–150 Mt range depending on how combined heat and power output is allocated.
References
- [1]European Commission. (2025). Report on the functioning of the European carbon market in 2024 (COM(2025) 735 final). European Commission. (2026, April 10). EU Emissions Trading System sustains downward trend in covered emissions [News release] — https://climate.ec.europa.eu/document/download/ddc1b1de-652b-49ed-8f15-d9fa8badd39f_en, https://climate.ec.europa.eu/news-other-reads/news/eu-emissions-trading-system-sustains-downward-trend-covered-emissions-2026-04-10_en
- [2]European Parliament & Council. (2003). Directive 2003/87/EC establishing a system for greenhouse gas emission allowance trading within the Union [Consolidated text]. Article 30c(2) sets the 2028 Union-wide quantity from reported 2024–2026 emissions; it is due to be published in 2027 — http://data.europa.eu/eli/dir/2003/87/oj
- [3]European Environment Agency. (2025). Emissions reduction from transport in Europe: How the ETS2 will help this sector meet its climate targets (Briefing 20/2025). European Commission. (2024). Commission Decision (EU) 2024/2951 on the Union-wide quantity of allowances for 2027 under Chapter IVa of Directive 2003/87/EC. Graichen, J., Cames, M., & Schumacher, K. (2024). ETS 2: Supply and demand (Climate Change 09/2024). Umweltbundesamt — https://www.eea.europa.eu/en/analysis/publications/emissions-reduction-from-transport-in-europe-how-the-ets2-will-help-this-sector-meet-its-climate-targets, http://data.europa.eu/eli/dec/2024/2951/oj, https://www.umweltbundesamt.de/sites/default/files/medien/11850/publikationen/09_2024_cc_ets_2_supply_and_demand.pdf
- [4]Eurostat. (2026). Complete energy balances (nrg_bal_c) [Data set]. Ember. (2026, January 22). European Electricity Review 2026 — https://doi.org/10.2908/NRG_BAL_C, https://ember-energy.org/latest-insights/european-electricity-review-2026/
- [5]Eurostat. (2026). Disaggregated final energy consumption in households – quantities (nrg_d_hhq) [Data set]. Bertoldi, P., & Atanasiu, B. (2009). Electricity consumption and efficiency trends in European Union: Status report 2009 (EUR 24005 EN). European Commission, Joint Research Centre — https://doi.org/10.2908/NRG_D_HHQ, https://doi.org/10.2788/39332
- [6]Gladushenko, R., Vautrin, A., Kueppers, M., Petropoulos, A., & Bouckaert, S. (2026, June 19). Delivering on the EU’s electrification ambitions [Commentary]. International Energy Agency — https://www.iea.org/commentaries/delivering-on-the-eu-s-electrification-ambitions
- [7]Transport & Environment. (2025). E-kerosene for aviation: Sizing the challenge. Transport & Environment is a Brussels-based federation of European clean-transport NGOs and the most widely cited independent modeller of e-fuel costs and volumes — https://www.transportenvironment.org/
- [8]European Parliament & Council. (2023). Regulation (EU) 2023/2405 on ensuring a level playing field for sustainable air transport (ReFuelEU Aviation). Transport & Environment. (2025). E-kerosene for aviation: Sizing the challenge — http://data.europa.eu/eli/reg/2023/2405/oj, https://www.transportenvironment.org/
- [9]European Commission. (2023). Commission Delegated Regulation (EU) 2023/1184 establishing a Union methodology for renewable fuels of non-biological origin. European Commission. (2018). Commission Implementing Regulation (EU) 2018/2066 on the monitoring and reporting of greenhouse gas emissions [Consolidated text] — http://data.europa.eu/eli/reg_del/2023/1184/oj, http://data.europa.eu/eli/reg_impl/2018/2066/oj
- [10]European Union Aviation Safety Agency. (2025). ReFuelEU Aviation annual technical report 2025 – 2024 in review — https://www.easa.europa.eu/en/document-library/general-publications/refueleu-aviation-annual-technical-report-2025
- [11]FuelsEurope. (2026). Statistical report 2026 — https://www.fuelseurope.eu/uploads/files/modules/documents/file/1782985874_e0WVgGToWDVzFOQbKF6jbVDru4R6MgodTNYtpZRL.pdf
- [12]European Commission. (2026). Proposal for a Directive of the European Parliament and of the Council amending Directive 2003/87/EC and Decision (EU) 2015/1814 as regards driving competitiveness and cost-effective decarbonisation (COM(2026) 616 final). European Parliament & Council. (2024). Regulation (EU) 2024/3012 establishing a Union certification framework for permanent carbon removals, carbon farming and carbon storage in products. European Commission. (2026). Commission Delegated Regulation (EU) 2026/285 establishing certification methodologies for permanent carbon removals. A proposal, not law — https://eur-lex.europa.eu/legal-content/EN/ALL/?uri=COM:2026:616:FIN, http://data.europa.eu/eli/reg/2024/3012/oj, https://eur-lex.europa.eu/legal-content/EN/TXT/?uri=OJ:L_202600285
- [13]Poretti, F. (2026, July 2). Getting hot: Will the revised EU ETS combat climate change while saving the environment? Waste Management World. Figures derived from the Commission’s 2024 EU ETS monitoring and reporting data — https://waste-management-world.com/resource-use/getting-hot-will-the-revised-eu-ets-combat-climate-change-while-saving-the-environment/
- [14]European Parliament & Council. (2018). Regulation (EU) 2018/842 on binding annual greenhouse gas emission reductions by Member States from 2021 to 2030 (OJ L 156, p. 26) [Consolidated text as amended by Regulation (EU) 2023/857] — http://data.europa.eu/eli/reg/2018/842/oj
- [15]European Commission. (2026). Commission Implementing Decision (EU) 2026/895 setting the annual emission allocations of the Member States for 2026 to 2030 — https://eur-lex.europa.eu/legal-content/EN/TXT/HTML/?uri=OJ:L_202600895
- [16]Verde, S. F. (2020). The impact of the EU Emissions Trading System on competitiveness and carbon leakage: The econometric evidence. Journal of Economic Surveys, 34(2), 320–343. Chen, H., Di Gregorio, M., & Paavola, J. (2026). Carbon leakage in emissions trading systems: A systematic review and meta-analysis of ex-ante and ex-post evidence. Climate Policy. Advance online publication. Zheng, X. S., Fan, X. K., Rhode, D., & Pavlenko, N. (2026). Aviation carbon leakage risks under an expanded EU Emissions Trading System (Publication ID 656). International Council on Clean Transportation — https://doi.org/10.1111/joes.12356, https://doi.org/10.1080/14693062.2026.2627750, https://theicct.org/publication/aviation-carbon-leakage-risks-under-an-expanded-eu-emissions-trading-system-jul26/
- [17]Plastics Europe. (2025). Plastics the Fast Facts 2025. Fearney, A. (2025, November 25). Chemicals in the CBAM: Time to step up [Policy brief]. Sandbag. Sandbag issued a corrigendum in February 2026 raising the excluded-chemicals figure to 203 Mt, or 36% of EU ETS industrial emissions — https://plasticseurope.org/knowledge-hub/plastics-the-fast-facts-2025/, https://sandbag.be/2025/11/25/chemicals-in-the-cbam-time-to-step-up/
- [18]European Commission. (2021). Impact assessment accompanying the proposal for a regulation establishing a carbon border adjustment mechanism (SWD(2021) 643 final) — https://eur-lex.europa.eu/legal-content/EN/TXT/?uri=CELEX:52021SC0643
- [19]Bellora, C., & Fontagné, L. (2023). EU in search of a carbon border adjustment mechanism. Energy Economics, 123, 106673 — https://doi.org/10.1016/j.eneco.2023.106673
- [20]Rocchi, P., & Elkerbout, M. (2026). Carbon borders and global signals: Assessing the EU carbon border adjustment mechanism. Journal of Cleaner Production — https://www.sciencedirect.com/science/article/pii/S0959652626001915
- [21]Marcu, A., Maratou, A., & Calvo Ambel, C. (2026, July 14). Carbon leakage under CBAM and free allocation: Summary for policymakers. European Roundtable on Climate Change and Sustainable Transition. ERCST is the European Roundtable on Climate Change and Sustainable Transition, a Brussels think tank whose CBAM workstream is funded by Eurofer, Cement Europe, FertilizersEurope, ACEA, BDI, Glencore and the French government — a funding profile worth knowing when reading its carbon-leakage conclusions — https://ercst.org/wp-content/uploads/2026/07/20260714_CL-under-CBAM-and-FA_summary-for-policymakers.pdf
- [22]European Commission. (2025). Commission Implementing Regulation (EU) 2025/2548 laying down rules on the calculation and publication of the price of CBAM certificates — https://eur-lex.europa.eu/legal-content/EN/TXT/HTML/?uri=CELEX:32025R2548
- [23]European Commission. (2019). Commission Implementing Regulation (EU) 2019/1842 as regards adjustments to free allocation due to activity level changes [Consolidated text] — https://eur-lex.europa.eu/eli/reg_impl/2019/1842/2022-06-19
- [24]Zaklan, A. (2023). Coase and cap-and-trade: Evidence on the independence property from the European carbon market. American Economic Journal: Economic Policy, 15(2), 526–558 — https://doi.org/10.1257/pol.20200584
- [25]Branger, F., Ponssard, J.-P., Sartor, O., & Sato, M. (2015). EU ETS, free allocations, and activity level thresholds: The devil lies in the details. Journal of the Association of Environmental and Resource Economists, 2(3), 401–437 — https://doi.org/10.1086/682343
- [26]European Roundtable on Climate Change and Sustainable Transition. (2025). 2025 state of the EU ETS report — https://ercst.org/2025-state-of-the-eu-ets-report/
- [27]European Commission. (2025). Report on the application of Regulation (EU) 2023/956 during the transitional period (COM(2025) 783 final) — https://eur-lex.europa.eu/legal-content/EN/TXT/?uri=celex:52025DC0783
- [28]European Commission. (2025). Proposal for a regulation amending Regulation (EU) 2023/956 as regards the extension of its scope to downstream goods and anti-circumvention measures (COM(2025) 989 final) — https://taxation-customs.ec.europa.eu/document/download/f270fb87-7fbe-4149-ba48-e8a568179db3_en
- [29]Sartor, O. (2013). Carbon leakage in the primary aluminium sector: What evidence after 6.5 years of the EU ETS? (USAEE Working Paper No. 13-106) — https://doi.org/10.2139/ssrn.2205516
- [30]Verde, S. F. (2020). The impact of the EU Emissions Trading System on competitiveness and carbon leakage: The econometric evidence. Journal of Economic Surveys, 34(2), 320–343 — https://doi.org/10.1111/joes.12356
- [31]Dechezleprêtre, A., Gennaioli, C., Martin, R., Muûls, M., & Stoerk, T. (2022). Searching for carbon leaks in multinational companies. Journal of Environmental Economics and Management, 112, 102601 — https://doi.org/10.1016/j.jeem.2021.102601
- [32]Naegele, H., & Zaklan, A. (2019). Does the EU ETS cause carbon leakage in European manufacturing? Journal of Environmental Economics and Management, 93, 125–147 — https://doi.org/10.1016/j.jeem.2018.11.004
- [33]Branger, F., Quirion, P., & Chevallier, J. (2016). Carbon leakage and competitiveness of cement and steel industries under the EU ETS: Much ado about nothing. The Energy Journal, 37(3), 109–136 — https://doi.org/10.5547/01956574.37.3.fbra
- [34]Chen, H., Di Gregorio, M., & Paavola, J. (2026). Carbon leakage in emissions trading systems: A systematic review and meta-analysis of ex-ante and ex-post evidence. Climate Policy. Advance online publication — https://doi.org/10.1080/14693062.2026.2627750
- [35]Zheng, X. S., Fan, X. K., Rhode, D., & Pavlenko, N. (2026). Aviation carbon leakage risks under an expanded EU Emissions Trading System (Publication ID 656). International Council on Clean Transportation — https://theicct.org/publication/aviation-carbon-leakage-risks-under-an-expanded-eu-emissions-trading-system-jul26/
- [36]Stockholm Exergi. (2025). Stockholm Exergi extends landmark carbon removal agreement with Microsoft. Ørsted. (2023, May 15). Ørsted awarded contract – will capture and store 430,000 tonnes of biogenic CO2. CDR.fyi. (2026). CDR.fyi [Data dashboard]. Retrieved August 25, 2026, from Fajardy, M., Greenfield, C., Bennett, S., & Gül, T. (2025, October 27). Driving down the cost of carbon removal: Why innovation matters [Commentary]. International Energy Agency. Battersby, F., Uzor, L., Costova, A., & Selén, V. (2026). Reaction paper: Legislative proposal on carbon removals in the EU Emissions Trading System. Carbon Gap — https://www.stockholmexergi.se/nyheter/stockholm-exergi-extends-landmark-carbon-removal-agreement-with-microsoft/, https://orsted.com/en/media/news/2023/05/20230515676011, https://www.cdr.fyi/, https://www.iea.org/commentaries/driving-down-the-cost-of-carbon-removal-why-innovation-matters, https://carbongap.org/media/2026/ets-reaction-paper.pdf
- [37]World Bank. (2026). State and trends of carbon pricing 2026. AlliedOffsets. (2026, July 20). Unpacking the EU ETS reform: 17th July 2026 analysis — https://openknowledge.worldbank.org/handle/10986/41544, https://blog.alliedoffsets.com/unpacking-the-eu-ets-reform-17th-july-2026-analysis
- [38]International Civil Aviation Organization. (2025). CORSIA programme re-assessment form, Appendix A: Supplementary information for assessment of emissions unit programmes — https://www.icao.int/sites/default/files/environmental-protection/CORSIA/Documents/TAB/Programme-Re-application-Form_Appendix_A_Supplementary_Information_2025.pdf
- [39]Sylvera. (2026, June). CORSIA countdown — https://info.sylvera.com/hubfs/CORSIA-Countdown-Report_Sylvera-June2026.pdf
- [40]AlliedOffsets. (2026, July 20). Unpacking the EU ETS reform: 17th July 2026 analysis — https://blog.alliedoffsets.com/unpacking-the-eu-ets-reform-17th-july-2026-analysis
- [41]Environmental Defense Fund & The Nature Conservancy. (2026, May). International credits in the EU: An options paper — https://library.edf.org/AssetLink/76xh30h3q602f2bq652eky8ues5d8xi5.PDF